



Next.js performance
What we did to make our own animation-heavy Next.js site load fast, grouped by area: measuring, UI, code, assets, third-party scripts and hosting on Cloudflare Workers. Every item comes with before and after numbers and how they were measured.
Phúc Bùi · October 10, 2026
Next.js gives you a lot for speed out of the box: prerendered pages, JavaScript split per route, image and font optimisation. An animation-heavy site can still be slow if you don't watch each part, though, and running on Cloudflare Workers instead of Vercel adds work that Next.js doesn't do for you.
This is what Perxel did to speed up our own website, grouped by area: measuring, UI, code, assets, third-party scripts and hosting. Every item has before and after numbers and the conditions they were measured in. The site runs Next.js 16, React 19, GSAP and a lot of canvas, on Cloudflare Workers through OpenNext. Most of it applies to any Next.js project; the hosting part is for sites on Cloudflare.
Measure before you fix
A PageSpeed score moves from run to run, so a single number can't tell you whether a change worked. The two runs below tested the same build of our homepage, a little over 13 hours apart: the first scored 68, the second 95.
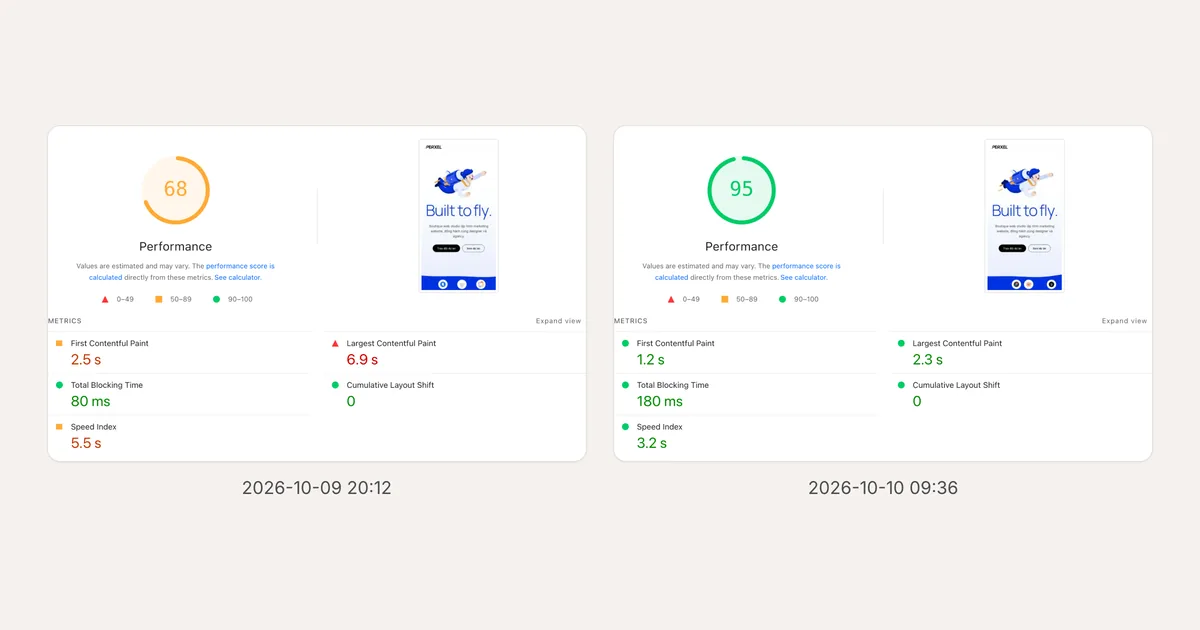
Same code, two PageSpeed mobile runs: 68 at 20:12 on 9 October 2026 and 95 at 09:36 on 10 October 2026.
So we measure by a few rules:
- Run Lighthouse locally, on the same version PageSpeed uses. PageSpeed Insights currently runs Lighthouse 13.5 with simulated throttling. The same version on your own machine gets close to PageSpeed and has no API quota.
- Take the median of several runs. On 10 October 2026, three mobile runs against production gave 86, 91 and 93, and two desktop runs gave 96. When comparing two versions, we run them in alternating pairs so both face the same machine conditions.
- Check LCP with real throttling when the number looks off. Simulated mode charges every request that starts before LCP to the LCP itself. Once it reported an LCP of 4.6 s where real throttling (
--throttling-method=devtools) measured 1.8 s. - Check PageSpeed's machine before blaming the code. PageSpeed once gave us 47 and 58 while the same Lighthouse version on our machine gave 83 to 98 for the same page. A TBT five to ten times higher usually means the test machine is slow or busy. It's listed under "CPU/Memory Power" at the bottom of the report.
- Look at
layout-shiftsbefore the CLS score. One shift can be the whole score. Lighthouse with--save-assetskeeps the trace, which records where each shifted element was. - To see what happens during load, instrument the page. We drive headless Chrome over the DevTools Protocol and inject a script that runs before anything else, logging
animationstart, DOM changes and everystartViewTransitioncall. That's how we found the view transition problem in the Code section below: neither the score nor CLS showed it.
How lab scores differ from real-user data (CrUX) is covered in PageSpeed Insights & Core Web Vitals.
UI: what people see first has to arrive first
The LCP element doesn't wait for JavaScript
The big headline on our homepage is the LCP element. In the first version it came in through GSAP, so it waited for JavaScript to load and run: mobile LCP was 8.7 seconds. Now the text fits its box with CSS (cqw over the line's width in em), the entrance is CSS keyframes, and a small inline script only reveals the block once the heading font has loaded (1.2 seconds at most). LCP dropped to about 1.8 seconds, the same as FCP.
Two details are easy to miss. First, the letters start at 1% opacity, not 0, because Chrome doesn't count an element first painted at opacity 0 as an LCP candidate. Second, the inline script sits at the end of the text block: the browser may paint while it waits on the script, so anything after it would pop in late and shift the centred headline.
The headline shows as soon as the page loads; the Lottie character comes in after.
Starting states live in CSS
Server HTML is painted before React hydrates. So if a useLayoutEffect changes the layout afterwards, visitors still see the page jump. On our homepage the hero pulls the blue band below it up by a screen with margin-top, for the rising water effect. At first JavaScript did that, and production CLS was 0.9 on mobile and 0.64 on desktop. Once the default moved into CSS (with JavaScript only overriding it afterwards), CLS went to 0.
The rule: any layout that JavaScript changes needs its starting state in CSS. Change that element's size and you change the CSS too.
A lighter UI on phones
On phones we keep the same content but swap a few heavy effects for lighter versions:
- The hero character has an inline SVG poster. The Lottie animation needs 486 KB of WASM, so below 768px the character's slot shows its first frame as inline SVG (22 KB, 9.6 KB gzipped) and switches to the Lottie once it's ready. Our first attempt used a WebP image, which then became the LCP element instead of the headline. Inline SVG isn't an LCP candidate.
- Water edges on touch screens are CSS, not canvas. On desktop the water edge is a canvas that reacts to the cursor. Phones have no cursor, so they get a wave-shaped mask slid sideways with
transform, with no script running per frame. - The tech logo band has a lite mode on phones. The water canvas draws at 1x pixel density, the logo discs get a flat 1px ring instead of an 18px blurred shadow, and the physics steps every other frame.
- Portrait screens get a plain project list. The row of cards that bends like a wave on canvas only runs on landscape screens at least 600px tall. Phones and upright tablets get a vertical list.
- Pinned sections use
position: sticky, not GSAP'spin: true. A GSAP pin switches the element toposition: fixedand moves it from JavaScript, which trails native scrolling on iOS Safari and jitters. With sticky, the browser holds the element and ScrollTrigger only drives the animation from the scroll position.
Heavy sections further down set up late
The canvas sections near the bottom of the page still create their pins and layout up front, because layout must not change later. Only the drawing and loading wait. The project cards load their images and video only once you scroll within about two screen heights of them. The pour title and the whale (font, letter layout, WebGL) set up 1.5 seconds after the page has loaded, or earlier on the first scroll, touch or key press. Before this, a 1.2 MB project video downloaded on page load even though it was several scrolls away.
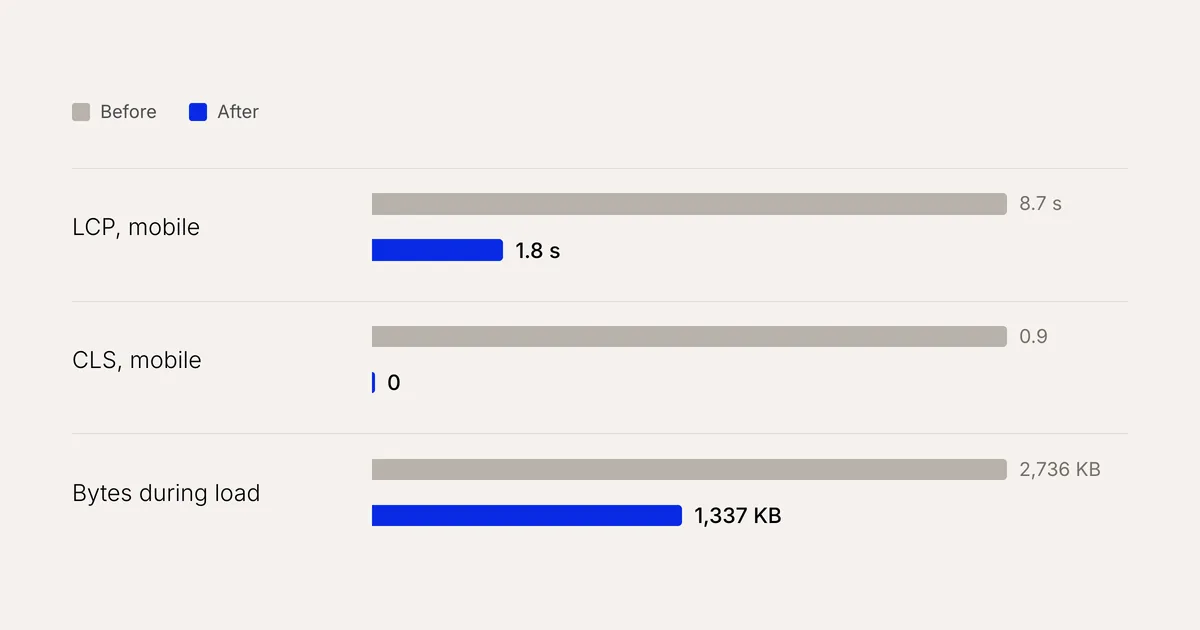
Homepage, mobile. LCP measured with Lighthouse under real throttling, CLS on production PageSpeed, bytes during load in headless Chrome with a 4x CPU slowdown (October 2026).
Code: each page loads only the JavaScript it needs
A server component can still pull client components into the page
Next.js puts every client component in a server component's module graph into that page's scripts, rendered or not. Our footer reads the list of posts on every page, and that list got its frontmatter by importing the MDX files. So every client component any post used (dialog, accordion, lightbox, Lottie player) shipped in every page's JavaScript: 5 to 18% of each page's JS.
The fix was to read frontmatter from JSON instead of MDX. A script that runs before next dev and next build writes every post's frontmatter to content/meta.generated.json, and only each post's detail route imports its MDX. This was the biggest single cut. To check whether a page loads code it doesn't use, search the chunks listed in its HTML for a component's class name.
An import behind a false flag still ships
Our old full-screen menu was switched off with a false constant, but Header still imported it. The bundler kept that import, so the animated cursor character and all its moods shipped on every page, on every device. In the same way, a single import of an old section that no longer rendered was enough to put the motion library on the homepage. Import a switched-off component with next/dynamic, or drop the import.
Code for one kind of device loads only on that device
The bottom navigation dock is only used below 1024px, the animated cursor only with a mouse, and Lenis (smooth scrolling) only with a scroll wheel. Each is its own chunk, loaded after hydration and only on the devices that use it: next/dynamic with ssr: false behind useMediaQuery, or import() inside an effect. The dock alone took 33 KB brotli off desktop.
After each build, check that every /_next/static path in the HTML exists. Once Turbopack emitted a preload for a chunk that didn't exist, which 404ed on post pages.
Links that are always on screen don't prefetch on sight
By default, Next.js <Link> prefetches a route when the link enters the viewport. Our header and footer link to every page, so the homepage downloaded the JavaScript of every other page right after it opened. We wrote our own link component that prefetches only on hover, focus or touch. Lighthouse's "unused JavaScript" went from 110 KiB to 22 KiB. The buttons on the first screen use it too, because a prefetch during load can end up waiting for the server to start (see Hosting).
View transitions wait for the first interaction
With the default auto, React's <ViewTransition> ran a transition for each update after hydration. On production there were three in the first 1.5 seconds, each a 300 ms cross-fade of a page snapshot over the live page, so the header and hero looked rendered twice. CLS stayed at 0, so the only way to see it was to log the startViewTransition calls. Now view transitions turn on only after the visitor's first interaction. Navigation always follows an interaction, so page transitions still work.
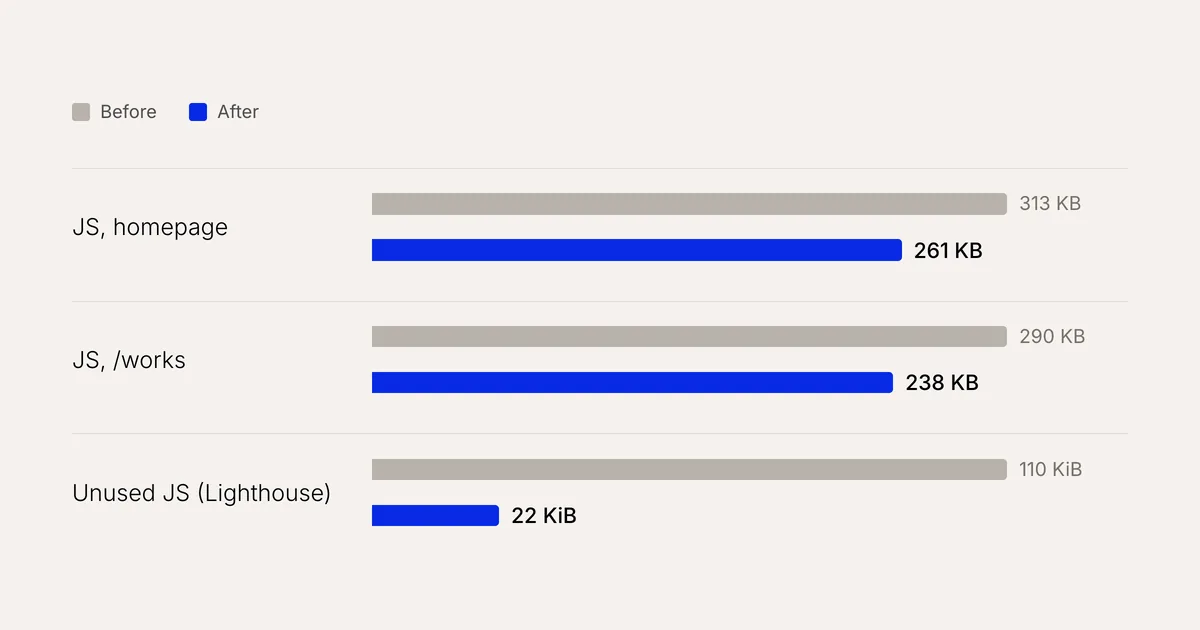
JavaScript each page loads (brotli, 9 October 2026) and Lighthouse's "unused JavaScript" on the homepage. Splitting code per device later took another 27 KB off the homepage on phones, and 18 to 19 KB off every other page.
Assets: fonts, images and video
- Self-host fonts and keep only the characters you use. With
next/font/google, a Vietnamese page also pulled the latin-ext subset, because ă, đ, ơ and ư fall inside its range: 7 font files, 218 KB before LCP. Now Inter and Manrope are one file each, cut with pyftsubset to the Latin and Vietnamese ranges: Inter 53 KB, Manrope 29 KB. - Any font in the DOM loads with the page, even at the very bottom. Geist was only used for a few numbers in the services list, yet it was 29 KB at load, and FCP came out at either 1.21 or 1.66 seconds depending on whether that request started before or after the first paint. The numbers moved to Inter with
tabular-numsand Geist left the project. - Images are close to the size they're shown at. Logos are capped at 128px, logos in the tech badges (shown at 24px) have their own 48px copies (the set went from 76 KB to 25 KB), project thumbnails are at most 1100px wide, and
sizesstays close to the real slot width. - A video's poster is a sized
<Image>, not theposterattribute. Theposterattribute has nosrcset, so phones downloaded an 1100px image for a 365px slot. - Videos are re-encoded for the size they're shown at. Project videos are encoded at 1120px, crf 34, no audio, with faststart: 20.5 MB down to 6.5 MB in total. A hidden video copy kept only for layout has
preload="none"so it doesn't download twice.
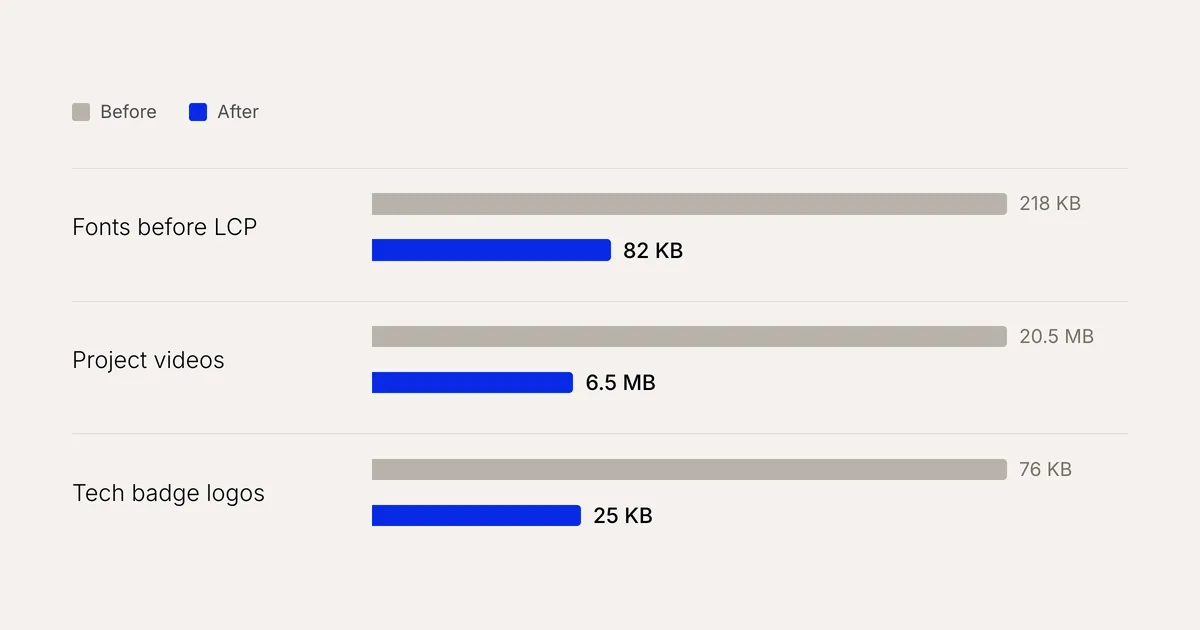
Font bytes before LCP on a Vietnamese page, total size of the project videos, and the tech badge logo set (October 2026).
Third-party scripts
Google Analytics and Cloudflare Web Analytics load on the visitor's first interaction (scroll, mouse move, touch, key press, click), or after 15 seconds if there is none. The wait used to be 8 seconds, which PageSpeed's run reached, loading gtag (172 KiB, 70 KiB of it flagged as unused).
We're open about this because it shows the limit of a lab score: the simulated run never scrolls or touches the page and finishes before 15 seconds, so it never counts these scripts. A real visitor loads them as soon as they scroll, after the page is already visible. The cost is that someone who leaves within 15 seconds without doing anything isn't counted. We installed the Cloudflare Web Analytics script by hand instead of letting Cloudflare inject it, because the automatic injection loads it with the page.
Hosting: Cloudflare Workers doesn't do what Vercel does by default
On Vercel, a prerendered page is served from the edge cache without starting the app. On Cloudflare, OpenNext packs the whole Next.js app into one Worker (17.5 MB in our case), and every request goes through it, including a request for HTML that was prerendered at build time.
The Worker has to start on the first request
On a low-traffic site, the Worker usually isn't already running near the visitor. In one Lighthouse run on production, the HTML took 2.84 seconds to start arriving, and every other request waited for it. On a single connection, the first HTML request waited 0.73 seconds and the next nine only 0.09 to 0.19 seconds, the same as a static CSS file. PageSpeed always measures a first visit, and so does everyone arriving from Google.
A small Worker in front of Next.js
We put a Worker of about 40 lines, with no Next.js code, in front of the OpenNext Worker. When a browser loads a prerendered page (GET or HEAD, no RSC or Next-Router-* header, no _rsc parameter), it answers with the HTML copy stored in static assets, with the same headers OpenNext sends. Everything else (navigation data inside the site, forms, API, images, OG images, 404 pages, redirects) goes on to the OpenNext Worker through a service binding. It's the same idea Vercel and OpenNext on AWS use for static pages, but OpenNext on Cloudflare doesn't offer it yet, so we wrote it ourselves.
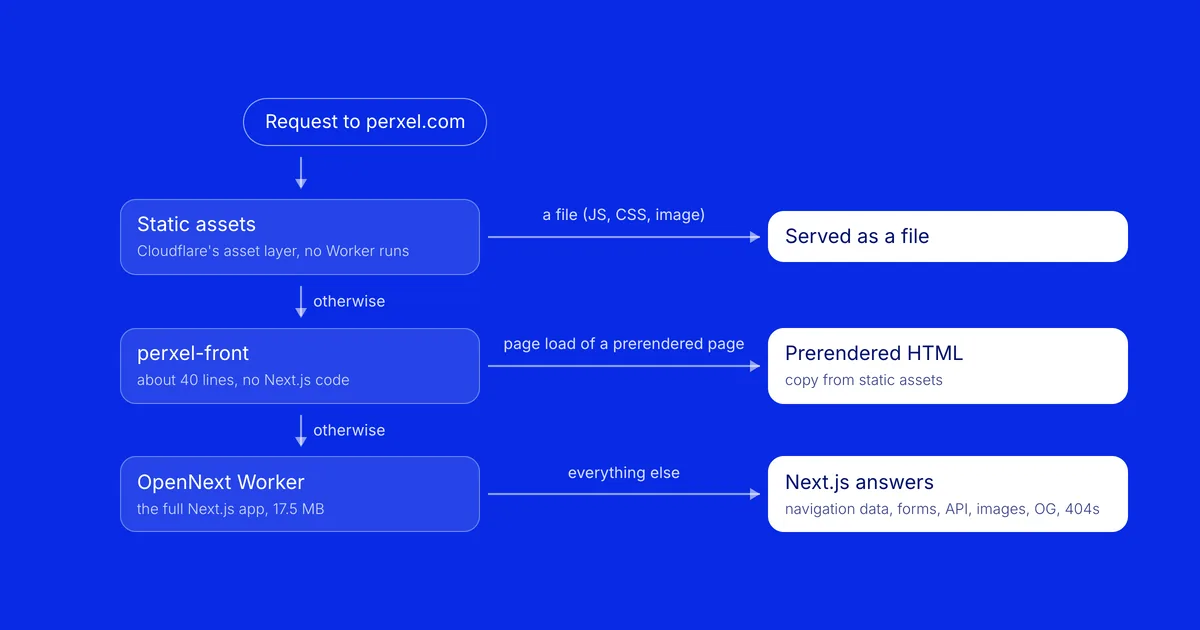
A request's path: the static asset layer, the small Worker in front, and only then the Next.js app.
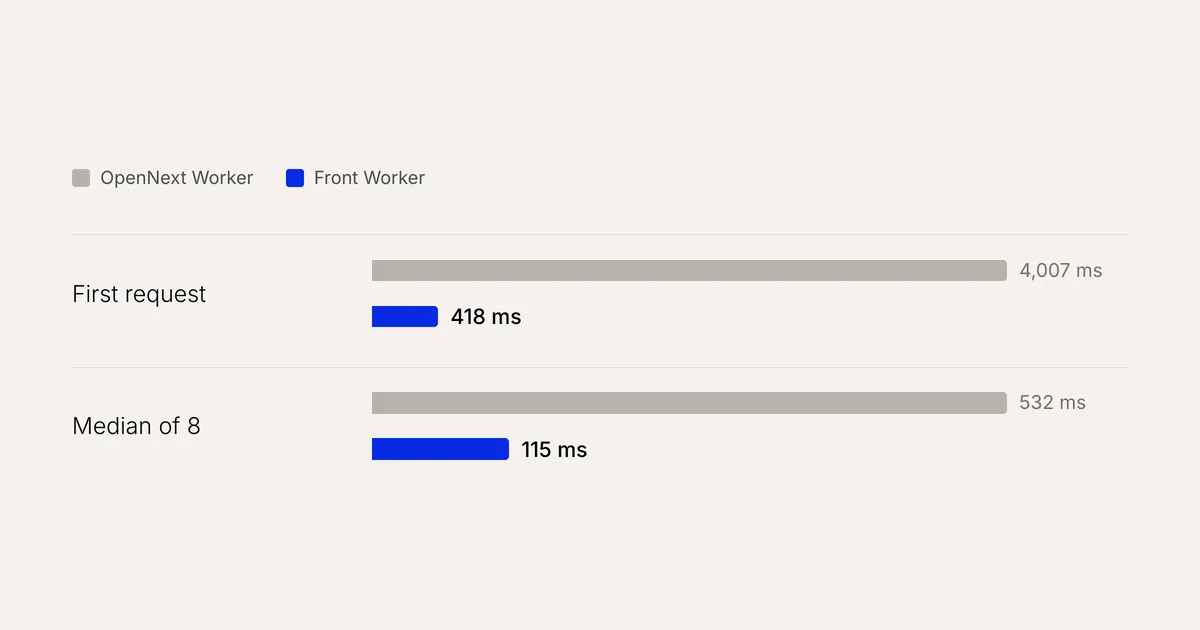
Server wait on production, measured with curl on 10 October 2026, 8 requests of each kind within the same minute. The two kinds aren't identical: page HTML goes through the small Worker, navigation data (RSC: 1) goes to OpenNext.
The small Worker relies on Next.js and OpenNext internals, not public APIs: the headers the router sends when it fetches navigation data, the build output layout, and the headers OpenNext sends with a page. If an upgrade changes them, links inside the site can break while the build still passes. So after every Next.js or OpenNext upgrade we run both Workers locally and go through a checklist: is the page served by the small Worker, does an RSC request reach OpenNext, is the HTML byte-identical to OpenNext's, are 404s and redirects right. After every deploy a script checks the same points on production. If something breaks, pointing the domain back at the OpenNext Worker takes seconds, since it still serves the whole site on its own.
Other Workers settings
- Long-term caching for
/_next/static. Files there have a hash in their name, so they can bemax-age=31536000, immutablein_headers. The default ismax-age=0, must-revalidate, so every repeat visit revalidated each chunk. - Turn on the
IMAGESbinding for/_next/image. Without it OpenNext serves the original image unresized: Lighthouse once flagged a 1440px image in a 634px slot. - No requests to OpenNext during load. Anything not prerendered (
/api/*, navigation data) wakes the OpenNext Worker, which sometimes takes 1 to 3 seconds. The status badge in our footer used to call its API twice on page load. Now it calls once, 1.5 seconds after load or on the first interaction. - No file reads at runtime. Workers has no disk, and OpenNext may re-run a static page's module when the cache is empty. An
fs.readdirSyncthat works innext buildwill throw in production. Our post lists are written out in code.
Tried and dropped
experimental.inlineCss. FCP under real throttling went from 2.1 to 0.8 seconds, but the PageSpeed score fell from 88 to 83 and simulated LCP rose by about a second. The CSS gets inlined twice (in the HTML and in the RSC payload), and simulated mode charges the bigger HTML to the LCP.- A Cloudflare Cache Rule for HTML. When a route has a Worker, the Worker runs first and the Cache Rule does nothing. If it did work it would be risky anyway: cached HTML would point at chunks removed by the next deploy.
- Deferring GSAP until after the hero. GSAP was only 44 KB of the 601 KB requested before LCP, against about 30 modules to change. We measured first and decided against it.
- Serving HTML from static assets inside the big Worker. This was only about 55 ms faster at the median, because the big Worker still had to start. That test took the median of mostly warm requests, so it couldn't see the start-up cost. The small Worker above fixes exactly that.
Checklist for the next Next.js project
- Measure with the Lighthouse version PageSpeed uses, take medians, compare in pairs, and confirm LCP with real throttling.
- The LCP element shows with HTML and CSS, without waiting for JavaScript.
- Any layout JavaScript changes has its starting state in CSS.
- On phones, swap heavy effects for lighter versions instead of just hiding them with CSS.
- Heavy sections lower on the page load their data only when the visitor gets close or first interacts.
- Check the client components in the module graph of every shared server component (layout, header, footer).
- Code for one kind of device lives in its own chunk, behind
useMediaQueryorimport(). - Links that are always on screen prefetch only on intent.
- Fonts are self-hosted and subset, and no font is added for a few small labels.
- Third-party scripts load after the first interaction, and the trade-off is written down.
- On Cloudflare Workers: static pages don't go through the big Worker,
/_next/staticis cached long term, theIMAGESbinding is on, and there's nofs.
FAQ
Do I need a Worker in front on Vercel?
No. Vercel serves prerendered pages from its edge cache without starting the app, so the first-request start-up cost mostly doesn't apply to static pages. The UI, code, assets and third-party sections apply the same way.
Should we chase the PageSpeed score?
We don't promise a score for any website. As the image at the top shows, the same build can score 68 or 95. The score also depends on content added later, the hosting and third-party scripts. A more useful goal is an LCP element that shows early, a page that doesn't shift, and pages that don't load code they don't use. Once a site has enough traffic, CrUX data is the number to look at first. PageSpeed Insights & Core Web Vitals walks through three real cases where the lab score and real-user data disagree.
Do phones lose the effects?
The content is the same on every device. Effects that need a cursor (water reacting to the mouse, the animated cursor) are desktop only. Heavy effects (the water canvas, the bending project cards) have lighter versions or become a plain layout on phones.
Footnotes
Want a quote?
Get in touch with Perxel today.